G4, 004, 2026
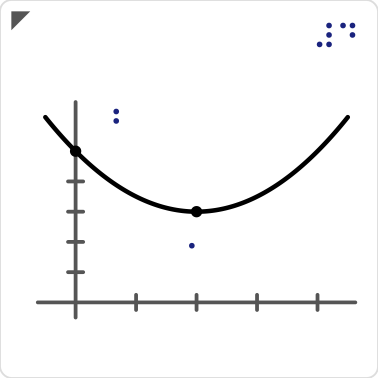
y = 0.5x2 - 2x + 5
Raised-line graph for x from -0.5 to 4.5
Braille ID G4
top-right corner of the plate
top-right corner of the plate
Touch checks TL-1 to TL-5 passed
After 3 attempts. The maths, scope and description guards passed too.
Print again
Asks Locus for more copies of this graph. Your school's print shop gets the order within about half an hour and replies to you with the price. Nothing is sent until you press Send in your mail.
Description for the learner
This tactile graph shows y = 0.5x^2 - 2x + 5, for x from -0.5 to 4.5.
Hold the plate with the raised triangle at the top-left.
The lowest point (vertex) is at x = 2, y = 3.
The curve crosses the y-axis at y = 5.
Each marked point has a braille letter next to it: a, the vertex; b, the y-intercept.
The braille number in the top-right corner, 4, is this graph's ID.
Note: automated checks measure spacing and size; they do not certify that a learner can understand the graphic.
What the touch check measured
TL-1: passed. Lines at least 3.2 mm apart; closest 3.39 mm.
How it was made
- Request #4 named a function, its x range and the points to mark.
- A GitLab Duo agent laid out the plate (session).
- The pipeline checked it like a fingertip would: passed after 3 attempts; the agent fixed its own layout.
- Released as graph-4-v1 and published here.
- Scale
- 100%, flat on the bed, no supports
- Hold
- Triangle at the top-left; braille ID at the top-right
- Profile
- fdm-handheld-v1 v1
- Built from
- commit 4b32f58b, pipeline 2973447276
- Files
- graph.svg, description.txt, manifest.json
Automated checks measure spacing and size; they do not certify that a learner can understand the graphic.